
Oakland County Housing Market October 2026
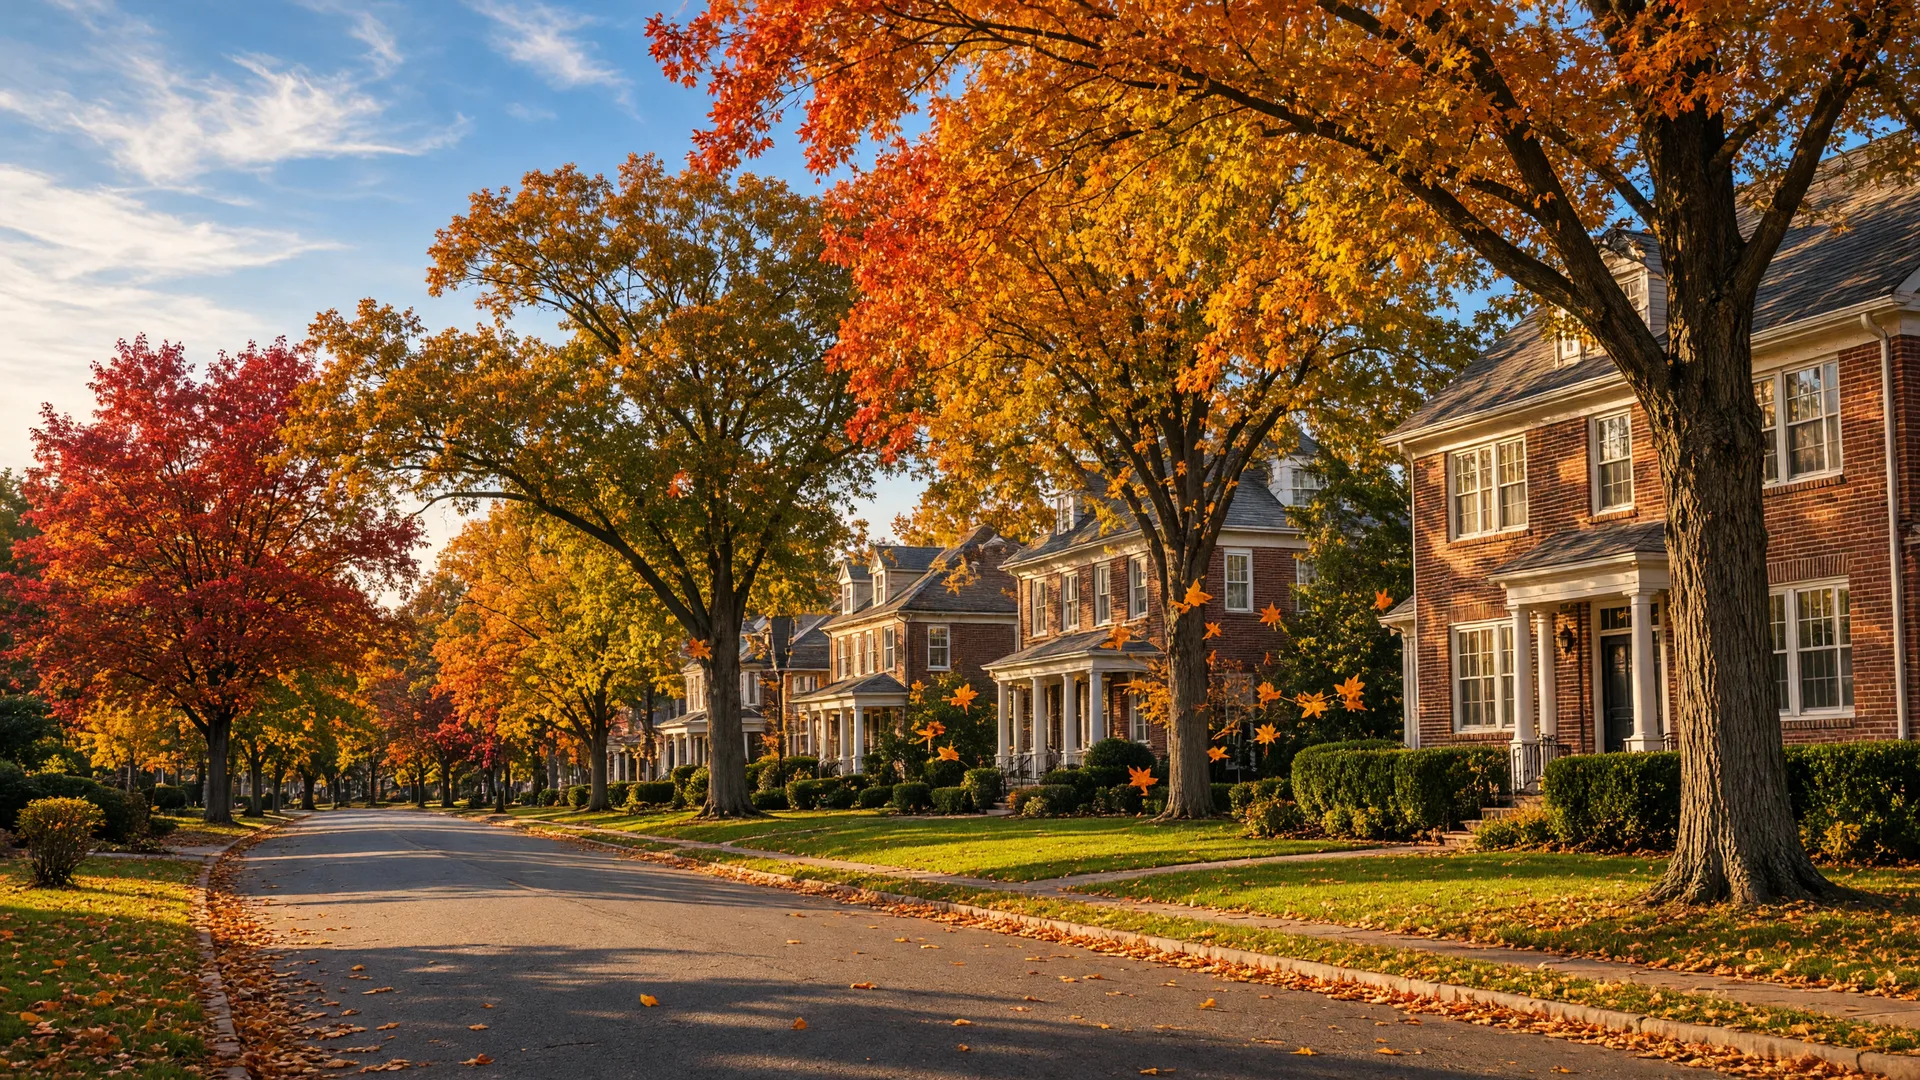
Oakland County single-family market snapshot, October 2026.
Oakland County’s October 2026 housing market gave buyers more choices and required sellers to pay closer attention to price, condition, and competition. The county recorded 2.81 months of inventory, a $391,250 median sold price, 22 median days in RPR, and a 98.2% sale-to-list ratio for single-family homes.
The market remained active, with 972 closed sales during the month, but the pace slowed from September. Active listings increased to 2,975, while the number of closed sales declined by approximately 10.6%. The combination of rising inventory and longer market time suggests that the seasonal market is becoming more balanced, although conditions still differ sharply among communities and price ranges.
Watch the Oakland County market video.
October 2026 Oakland County Housing Market Statistics
- Median sold price: $391,250
- Months of inventory: 2.81
- Median days in RPR: 22
- Sale-to-list ratio: 98.2%
- Closed sales: 972
- Active listings: 2,975
- New listings: 1,712
- New pending listings: 902
- Median sold price per square foot: $224
Realtors Property Resource® also reported a median estimated property value of $409,020, down 0.3% from the prior month and up 1.8% over the previous 12 months. Estimated values and closed-sale medians measure different things, so they should not be used interchangeably.
How the Market Changed From September
The saved monthly tracker shows several signs of a slower October market. Inventory increased from 2.60 months to 2.81 months. The median sold price moved from $410,000 to $391,250. Median market time increased from 18 to 22 days, while the sale-to-list ratio declined from approximately 99.0% to 98.2%.
New listings declined by about 5.2%, but active inventory still increased by approximately 6.0%. This indicates that available homes accumulated faster than they were absorbed during the month. Closed sales declined from 1,087 to 972, and the median sold price per square foot moved from $234 to $224.
These changes do not establish that every Oakland County property declined in value. Monthly medians can shift when the mix of sold homes changes. A larger share of smaller, less expensive, or differently located sales can lower the county median even when comparable homes in a specific neighborhood remain stable.
Oakland County Home Prices by Community
Oakland County is made up of distinct local housing markets. October median sold prices ranged from $175,250 in Hazel Park to $950,000 in Birmingham among communities reporting closed-sale activity. Bloomfield Hills recorded a $775,000 median, Northville reported $771,750, South Lyon reached $630,250, and Novi recorded $540,000.
Other October medians included $478,500 in Rochester Hills, $475,000 in Troy, $460,000 in Clarkston, $400,000 in Farmington Hills, $350,000 in Royal Oak, $320,000 in Clawson, $299,900 in Holly, $265,000 in Ferndale, and $238,125 in Oak Park.
The number of sales behind each median matters. A community with four sales can show a dramatic month-to-month movement because one unusually large or small property has an outsized effect. For this reason, monthly community medians should be treated as market snapshots rather than property valuations.
Where Homes Moved Quickly
Commerce Township recorded a 12-day median market time across 36 October sales. Clarkston posted a 15-day median across 38 sales. Berkley recorded 16 days across 28 sales, and Birmingham reported 17 days across 29 sales. Novi and Troy both reported 18-day medians with 27 and 59 sales, respectively.
Some smaller samples produced even faster figures. Wixom recorded a six-day median from nine sales, while Farmington recorded seven days from seven sales. These results are worth watching, but they should not be generalized to every property in those communities.
What the October Market Means for Sellers
Sellers are competing with more active listings than they were in September. Buyers can compare price, condition, layout, updates, and location across a wider selection. A home that enters the market above the most relevant comparable sales may spend more time listed and require a later adjustment.
The county’s 98.2% sale-to-list ratio still indicates that buyers paid close to asking price on average. However, the decline from September suggests that negotiation has become more common. Sellers can improve their position by completing practical preparation, presenting the property clearly, reviewing active competition, and selecting a price supported by recent local evidence.
What the October Market Means for Buyers
Buyers generally had more choices and more time in October. Longer market times may allow a buyer to compare properties, complete due diligence, and discuss terms with greater care. Depending on the home and local competition, buyers may also have more opportunity to negotiate price, repairs, possession, or closing costs.
Competition has not disappeared. Novi averaged 100% of list price across 27 sales, while Farmington Hills averaged 99.7% across 51 sales. Buyers should be prepared to move decisively when a property is well priced and matches their needs.
How to Estimate an Individual Home Value
A county median cannot determine the value of an individual property. A reliable analysis should consider recent comparable sales, current listings, pending competition when available, property condition, improvements, square footage, lot characteristics, location, and buyer response to similar homes. The most useful comparables are usually the properties that a likely buyer would consider as alternatives.
Get a Personalized Oakland County Market Analysis
If you are planning to sell, preparing for a future move, or reviewing your current equity, contact Joyce England, REALTOR® with Keller Williams First, for a personalized market analysis based on your property and its immediate competition.
Your Home. Your Story. My Expertise.
Keep Reading
- Oakland County Housing Market: September 2026 Update : the prior month’s snapshot for comparison.
- Oakland County Housing Market: August 2026 Update : two months of rising choice and shifting leverage.
- Oakland County July 2026 Market Update : steady prices and limited inventory in the summer market.
- Get a Personalized Home Evaluation : see where your property stands in today’s market.
- Lake Orion Community Guide : lake life and local character in northern Oakland County.
- Clarkston vs. Lake Orion: Oakland County Compared : how two of the county’s active communities differ.
- Milford & Highland: Lakes and Trails in Oakland County : recreation and countryside in the county’s western communities.
- Buyer & Seller Resources : guides, checklists, and tools for your next move.

Keller Williams First · Licensed since 2014 · 20+ years of real estate industry experience · 810-513-3335 · joyce@midmichiganliving.com
Data source: Realtors Property Resource® listing data and public-record estimates for October 2026 single-family homes. Information is deemed reliable but is not guaranteed. Community medians are monthly snapshots and are not individual property valuations. Equal Housing Opportunity.